Integrating charts from a model-driven app into a Power Pages portal enhances user experience by providing real-time data insights. In this post, we’ll show how to embed an Industry-Wise Account Distribution chart using Liquid code.
Use Case: Industry-Wise Account Distribution
A company using Dynamics 365 CRM wants to display the distribution of accounts by industry—such as Manufacturing, Healthcare, and IT Services—to its partners and stakeholders via a portal. This helps in:
Offering insights into customer segments.
Identifying industry opportunities for sales.
Promoting transparency with real-time data.
Implementation Overview
We’ll use Liquid code to embed a model-driven chart in a Power Pages portal. This allows CRM data to be visualized without granting direct CRM access.
Steps:
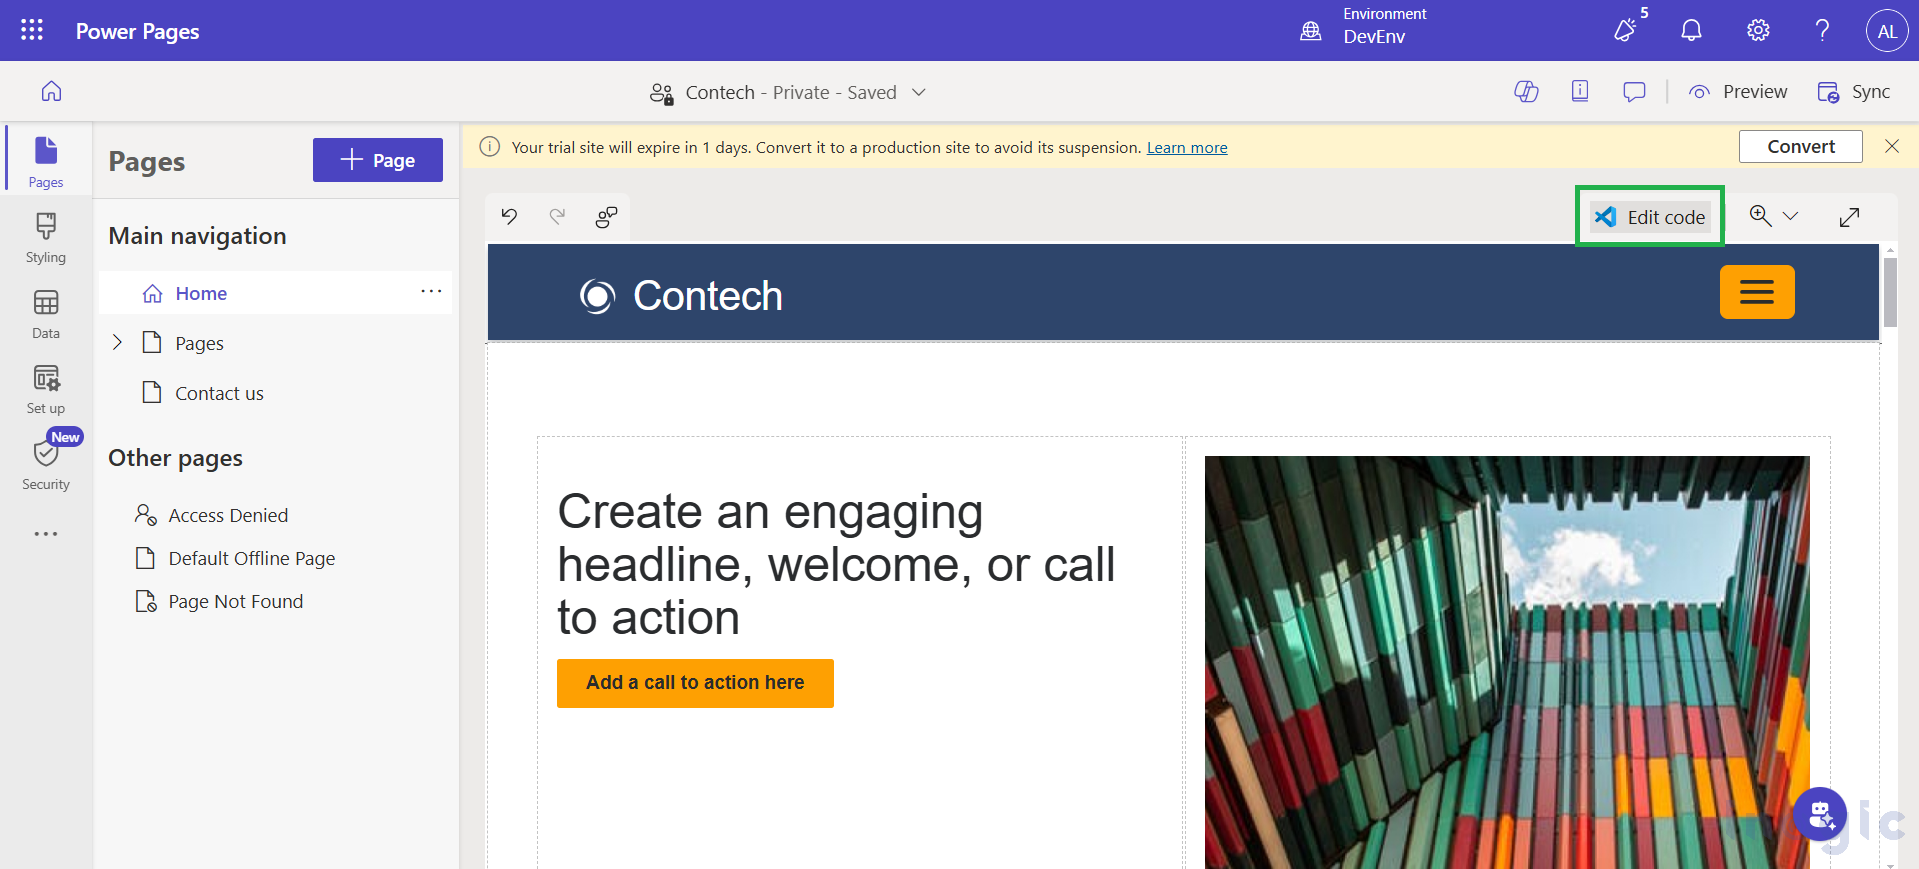
Set up your Power Pages portal using a predefined template.
Open the Edit Code section in Visual Studio.
Use Liquid to fetch and render the CRM chart based on the Industry field in the Account entity.
For beginners, refer to Liquid template documentation for guidance.
This integration delivers powerful, dynamic visual insights right within your portal.
Read More...