✨ Introduction
Working with large volumes of data in Excel can be overwhelming without proper summarization. One of the most powerful tools for summarizing data is the Pivot Table. But what if you want to automate the entire process — from opening your input data to generating a pivot table — without manual clicks?
👉 Many suggest using VBScript to automate Pivot Table generation. However, in my experience, VBScript didn’t consistently produce the desired results—especially when handling dynamic input data or formatting. To overcome those limitations, I opted for a more robust and flexible approach using Power Query and a pre-defined Pivot Table template. This method works reliably and integrates well with Power Automate Desktop (PAD).
This blog will walk you through how to create a Pivot Table template using Power Query and automate it using PAD. Whether you're an RPA enthusiast or a business user looking to streamline reporting, this step-by-step guide will help you automate Excel-based data summarization like a pro.
📌 Step-by-Step: Creating a Pivot Table Template using Power Query in Excel
Step 1:
Open a new Excel file. Copy your input data with headers into the sheet and format it as a Table (Ctrl + T).
Step 2:
Rename the first sheet to "InputData". Add a new sheet and name it "Pivot".
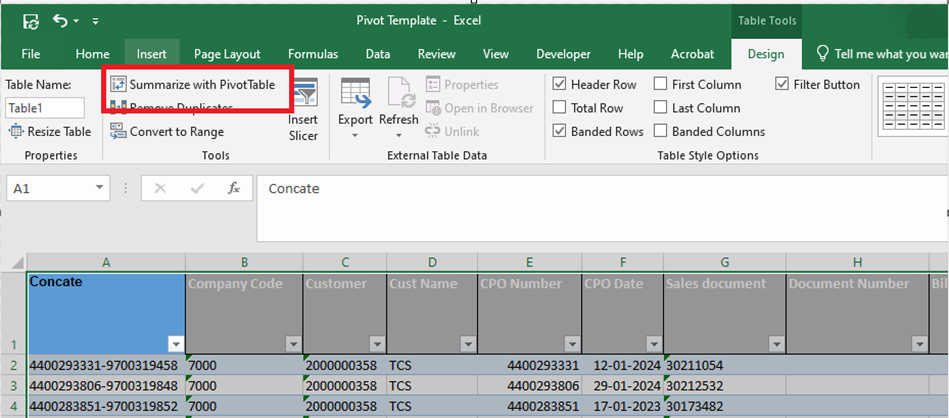
Step 3:
On the InputData sheet, go to the Design tab and click "Summarize with Pivot Table". as shown in below image.
Step 4:
In the dialog, select to insert the Pivot Table into the existing worksheet, and set the location as shown in below images.
Step 5:
You’ll now see a blank Pivot Table ready to be configured.
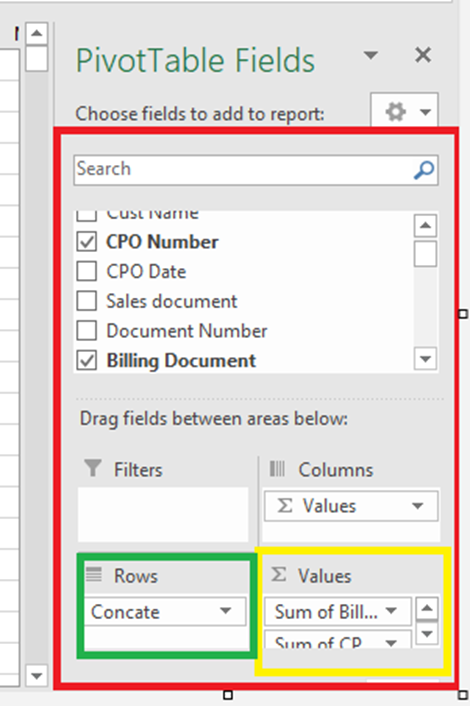
Step 6:
Drag and drop the necessary fields (Rows, Columns, Values) into the Pivot Table layout as shown in below image.
Step 7:
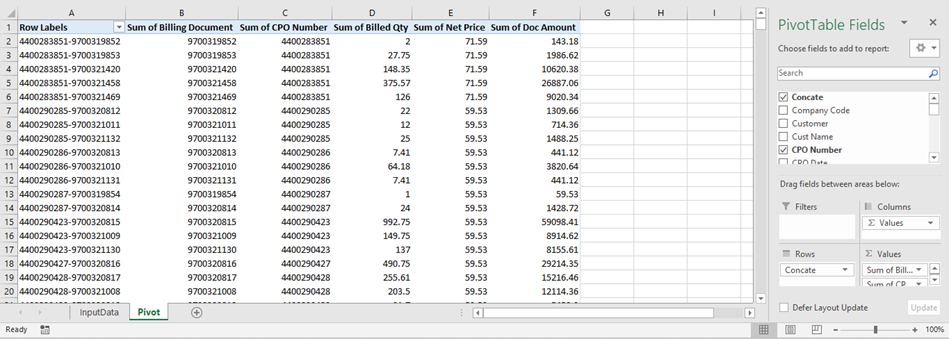
Once you're happy with the Pivot setup, save the file as your template. You will use this file in Power Automate Desktop.
Below is example Pivot table as shown in below image.
🤖 Using the Pivot Template in Power Automate Desktop
🔧 Flow Overview
You’ll need two Excel files:
📷 Flow Image
💡 Flow Code Snippet
✅ Output
After executing the flow, your Pivot Table will be automatically updated with fresh data, ready for reporting — no manual refresh needed!
🔚 Conclusion
Automating Pivot Table generation in Excel using Power Automate Desktop not only saves time but also improves consistency in data processing. With this setup, your reporting can become hands-free, accurate, and repeatable.
Whether you're working in finance, operations, or analytics, this technique helps bridge Excel's powerful features with RPA capabilities.
If you have any questions or enhancements, feel free to comment below or connect with me in the Power Automate Community!


